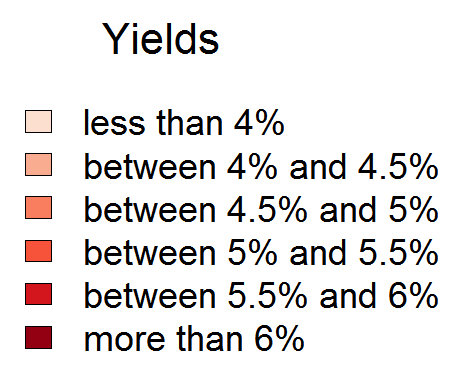
Rental Yield Heat-Map
Press release: 20th August 2013
Study locates hottest Buy-to-Let locations yielding up to 10%
New research from Home.co.uk and Move with Us reveals surprising insights into gross rental yields 1 across England and Wales. With low returns for savers expected for the next three years and attractive Buy-to-Let deals now available, this research identifies yield hotspots at a postcode district level.
Rental Yield Heat-Map for England & Wales
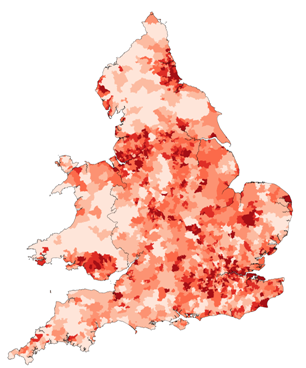
The unique study, which looked at 2-bedroom properties for sale and for rent, identified that the highest yields are scattered widely across regions and mainly outside of Greater London. The combination of lower capital costs and reasonable rental prices has delivered gross yields in the range of 8.7% to 10.6% in the top ten yielding postal districts. Birmingham has three postal districts in the top ten which indicates that the second city's rental sector presents significant opportunities. Overall, the pattern shows that the high yielding hot spots are mainly in more densely populated urban and suburban environments where housing demand is strong. The highest yielding areas of Wales are to the north of Cardiff, and return 7.5%.
Top 10 Yielding Postal Districts in England & Wales
| Postal District | Gross Rental Yield | |
|---|---|---|
| 1 | B7 (Birmingham) | 10.6% |
| 2 | TN28 (Kent) | 10.5% |
| 3 | L14 (Merseyside) | 9.6% |
| 4 | GU6 (Surrey) | 9.5% |
| 5 | TS1 (Middlesbrough) | 9.2% |
| 6 | B35 (Birmingham) | 9.2% |
| 7 | L4 (Liverpool) | 9.1% |
| 8 | RH4 (Surrey) | 9.1% |
| 9 | B18 (Birmingham) | 8.7% |
| 10 | EN8 (Hertfordshire) | 8.7% |
At the other end of the spectrum rental property is only offering landlords a return in the region of 2% in the more isolated areas of England and Wales. Countryside locations, e.g. Brecon Beacons, Rural Devon, Peak District, Yorkshire Dales, Exmoor and Dartmoor, are more sparsely populated and tend to attract homeowners rather than the young professionals who will pay a rent premium for living near to work and nightlife.
Doug Shephard, Director at Home.co.uk, commented:
"This new study is a route map for investors in search of the highest potential rental yields. Landlords clearly need to be open-minded about where to invest and not simply look in their immediate area. A highly localised approach identifying the ultimate combination of in-demand property types, lower capital investment and higher rental prices will deliver good yields and fewer voids, and maximise potential returns. However, whilst gross rental yields can be attractive, it is important for investors to appreciate that changing capital values can radically alter the real investment potential. In our next analysis we will take a look at mapping 'real yields' across England and Wales."
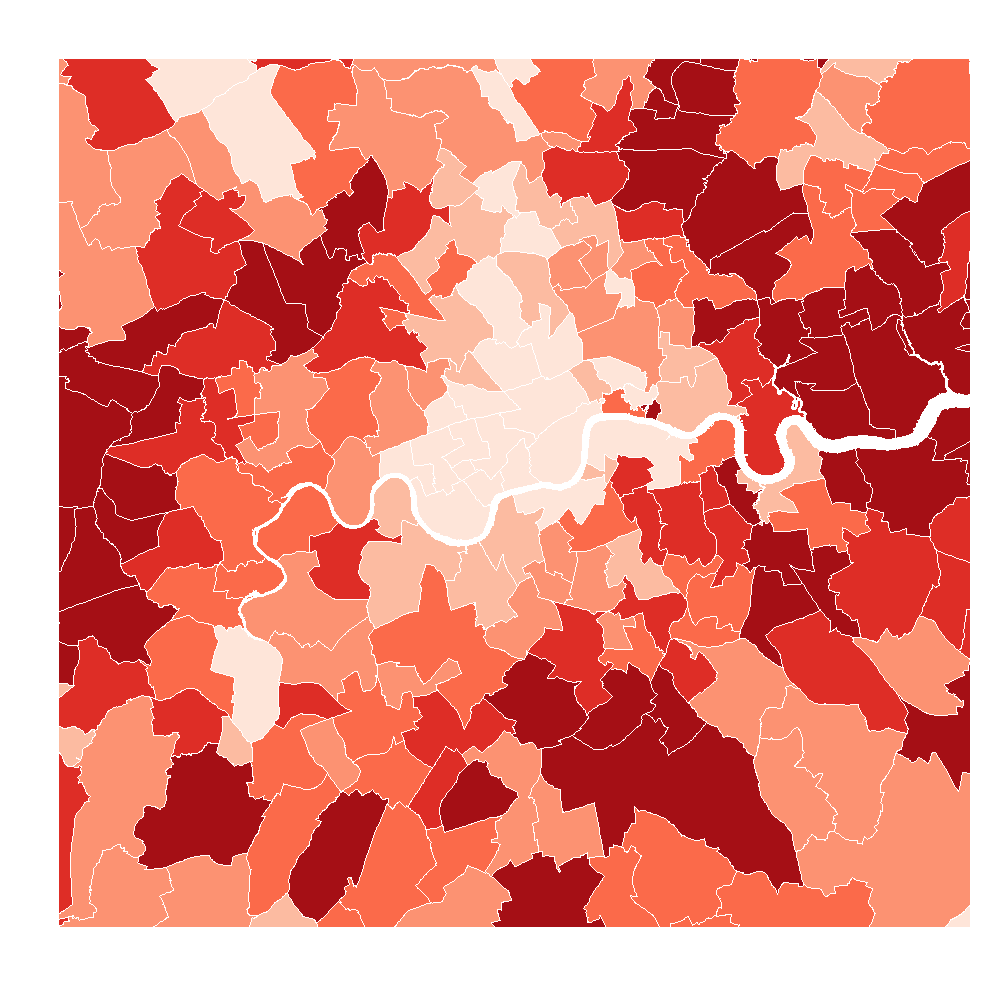
Rental Yield Heat-Map for Greater London
See also: Central London Rental Yield Heat-Map including Postal Districts and Yields
This research reveals that large swathes of Greater London currently return an average yield of less than 4%. This is at odds with strong house price growth widely reported in the capital. Infrastructure investment into the Stratford area has created a lasting legacy for landlords. Three of the top five Greater London postcodes clustered within sight of the Olympic area (E15, E13 and E6) return yields of over 7%.
Top 5 Yielding Postal Districts in Greater London
| Postal District | Gross Rental Yield | |
|---|---|---|
| 1 | N9 (Lower Edmonton) | 7.8% |
| 2 | E13 (Plaistow) | 7.5% |
| 3 | SE2 (Abbey Wood) | 7.4% |
| 4 | E6 (East Ham) | 7.2% |
| 5 | E15 (Stratford) | 7.2% |
Sean King, Chief Executive Officer at Move with Us, commented:
"Landlords looking to maximise yield will need to look outside of Central London. Commuter belts to the west and east of London are clearly yield hot spots as renters look to access the capital's work and social opportunities without the cost of renting a Central London property."
Sources: Home.co.uk Asking Price Index, Move with Us Rental Index
1 Gross rental yield is defined as median annual rent divided by median asking price. The data was collected during the first 6 months of 2013 for 2-bedroom properties advertised online for sale and rent.
Notes for Editors
Over the last 29 years, Home.co.uk has become established as a dynamic, innovative and ethical service. By providing the UK's most comprehensive Property Search and Estate Agents directory coupled with detailed House Price analysis, Home.co.uk delivers the real power of the Internet to inform and empower estate agents, homebuyers, renters, landlords and sellers in across the UK.
Move with Us are recognised experts in UK residential property. They provide a broad range of services to help consumers and businesses value, manage and sell their properties. They offer services to landlords from centralised property management and data analysis, right through to advisory on acquisition and property disposal. These services are designed to optimise yield and manage risk across any size of rental property portfolio. For further information on the services offered by Move with Us go to www.movewithus.co.uk.
The Move with Us Rental Index is based on a weekly snapshot of over 150,000 rental properties advertised on major portals across eleven regions in the UK. This allows us to base our analysis on upwards of 7.8 million data points annually, the largest sample available for a rental index. It delivers a national and regional indicator of rental market conditions for each quarter.
The methodology was devised by Home.co.uk in collaboration with Dr Phillippe Bracke of the London School of Economics. The map was prepared by Data Economics (www.dataeconomics.com).
Contact Details
Name: Home Team
Email address:
Telephone number: 0845 373 3580
Back to Home.co.uk Press