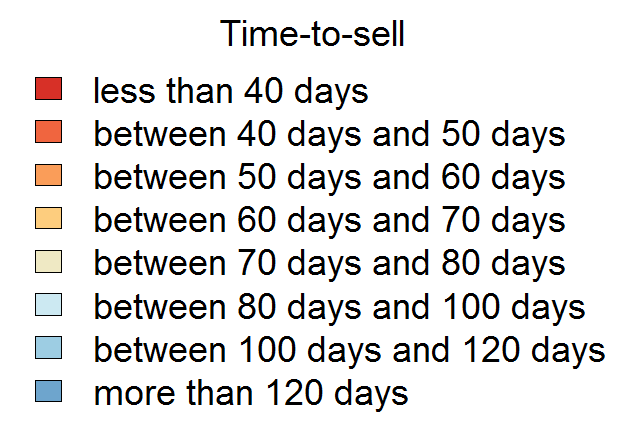
Average Time-to-sell in England and Wales by Postal District (July 2013)
Use the navigator icon to pan, zoom in and zoom out of the map. Click on the map to see the current statistical snapshot for a particular postcode district.

Chart is based on properties sold in the 180 days up to July 2013.
Data source: home.co.uk